7 Ways Online Shopping Changed How People Spend Money
Walking through a physical store in 1995 and shopping at Amazon in 2025 are nominally the same activity — you want something, you go get it, you pay — but virtually every step of the transaction has been re-engineered to extract more spending with less friction.
The patent on a single mouse click. Algorithmic prices that change two million times a day. The strategically placed star rating that determines whether you click “buy.” The “pay in four” button that pretends to be a feature but is actually credit. Each of these is a piece of behavioral economics dressed up as convenience, and most of them have measurable effects on how much people spend, when, and on what.
Seven specific shifts that have rewired consumer behavior in two decades, with the patents, studies, and data behind each one.
Amazon patented the single mouse click in 1999 — and licensed it to Apple for an undisclosed sum reportedly around $1 million
U.S. Patent 5,960,411, “Method and System for Placing a Purchase Order Via a Communications Network,” was filed September 12, 1997 and issued September 28, 1999. The named inventors were Peri Hartman, Jeff Bezos, Shel Kaphan, and Joel Spiegel. The patent covered the act of completing an online purchase with a single click, using previously stored billing and shipping information.
Apple licensed the 1-Click patent in 2000 for an undisclosed amount widely reported as approximately $1 million, and used it across iTunes, the App Store, and iPhoto. Amazon’s effective monopoly on a single mouse click is estimated to have generated up to $2.4 billion in additional revenue across the patent’s 17-year life — by capturing impulse buys that would otherwise have hit checkout friction and been abandoned. The full 1-Click expiration is documented in the trade press.
The patent expired on September 12, 2017. Every e-commerce site immediately added one-click checkout. The single-click standard, which Amazon owned for nearly two decades, became table stakes across the entire industry overnight.
The average online shopping cart abandonment rate is 70.19% — and Baymard Institute calculates that fixing checkout problems could recover $260 billion in lost orders
The Baymard Institute, a Copenhagen-based UX research firm, has been tracking online shopping-cart abandonment rates for 14 years. Their meta-analysis of 49 separate published studies (2006-2023) puts the current global average abandonment rate at 70.19%. Mobile abandonment runs higher than desktop — 80.02% versus 66.41%.
The implication is that roughly seven out of every ten online shopping carts are filled and then abandoned without checkout. Baymard’s UX testing on the underlying causes — surprise shipping costs, mandatory account creation, lengthy forms, unclear return policies — concludes that interface improvements could lift conversion rates by 35.26%. The full checkout research estimates that $260 billion in lost orders is recoverable in the U.S. and EU alone, purely from interface refinements.
The cultural implication is the more interesting part. “Adding to cart” has functionally stopped being a buying signal and become a wishlist or price-watch behavior. Retailers know this and have responded with retargeting ads, abandoned-cart emails, and time-limited discount triggers — all of which are downstream consequences of the same 70% statistic.
Products with five reviews are 270% more likely to be purchased than products with zero — but rating likability peaks between 4.0 and 4.7, not at 5.0
The Medill Spiegel Research Center at Northwestern University, using anonymized data from PowerReviews, published the foundational study on the conversion impact of online reviews. The headline finding: products with five user reviews are 270% more likely to be purchased than products with zero reviews. The effect is non-linear and saturates quickly — going from five to fifty reviews doesn’t multiply the effect by ten.
The counterintuitive part is what happens to ratings as they approach perfection. Purchase likelihood peaks at ratings between 4.0 and 4.7, then declines as ratings approach 5.0. Shoppers actively distrust products with perfect scores; the assumption is that the reviews are fake. The Spiegel data also shows the effect is stronger on expensive items — a 380% conversion bump on high-priced products versus 190% on cheap ones. The full Spiegel report documents the regression model.
The cultural displacement is significant. Strangers’ star ratings have replaced friends’ recommendations as the primary trust signal for most consumer-product decisions. The verb “Google it” was followed by “check the reviews” as the dominant pre-purchase ritual, and most modern e-commerce design treats the review section as a more important conversion tool than the product description.
Amazon makes more than 2.5 million price changes per day — and its biggest competitors make about 50,000 in an entire month
The price-intelligence firm Profitero reported in December 2013 that Amazon.com was making more than 2.5 million individual price changes per day — a 10x increase from December 2012, when the figure was 269,113. The data was generated from Profitero’s automated scraping of Amazon product listings.
The comparison number is what makes the figure surprising. In the same December 2013 month, Best Buy and Walmart combined made just over 50,000 price changes for the entire month — meaning Amazon repriced more product SKUs in a single hour than its two biggest competitors did in 30 days. The full Profitero report documents the methodology.
The behavioral consequence is that “the price” of any given product is no longer a stable property. It’s a moving function of demand, competitive pressure, your browsing history, and time of day. Price-tracking tools like camelcamelcamel.com exist specifically because the customers who care can no longer assume the price they see is the price they’ll see tomorrow. The default expectation that prices fluctuate constantly didn’t exist before e-commerce; it does now.
Klarna was co-founded by two former Burger King employees in 2005 — and the BNPL category they helped invent now serves 93 million U.S. consumers
Klarna was founded in 2005 in Stockholm by Sebastian Siemiatkowski, Niklas Adalberth, and Victor Jacobsson. Siemiatkowski and Adalberth had previously worked together flipping burgers at Burger King in Sweden before starting the company. The original product was a payment-deferral service that let online shoppers receive a product first and pay later via invoice.
By 2024, 93.3 million U.S. consumers had used a Buy Now Pay Later (BNPL) product. The U.S. BNPL market had reached $109 billion in gross merchandise volume. Klarna alone served 42.8 million U.S. users in 2024, averaging $513 per user. Affirm users — fewer in number at 16.4 million — averaged $1,227 each. The full BNPL guide from eMarketer documents the U.S. adoption curve.
The behavioral shift is that “Pay in 4” has effectively replaced layaway and quietly extended what counts as an impulse-purchase price ceiling. A consumer who would not spend $400 on a pair of headphones in one transaction will spend $100 per month for four months on the same headphones, because the friction has been redistributed. BNPL is now standard at retail checkout for goods well above the price points originally targeted — including furniture, appliances, and four-figure purchases.
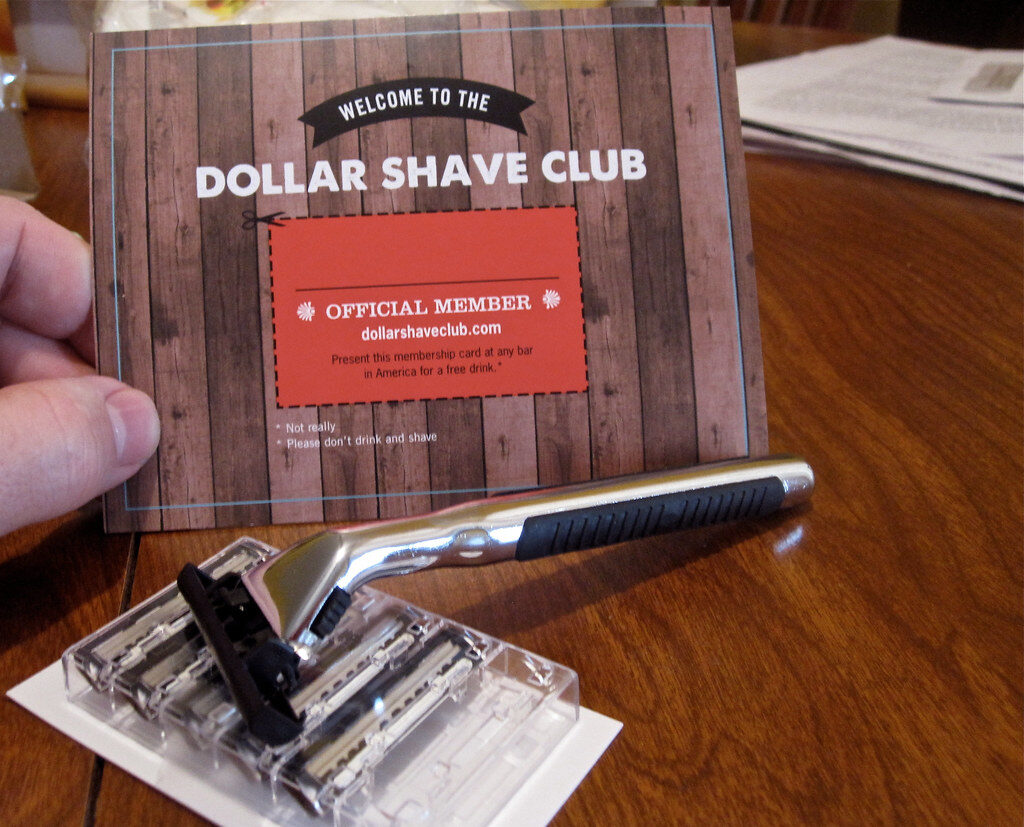
Dollar Shave Club launched with a $4,500 viral video in March 2012 — and sold to Unilever for $1 billion four years later
Michael Dubin launched Dollar Shave Club with a YouTube video titled “Our Blades Are F***ing Great” on March 6, 2012. The video was shot in a single day for $4,500. The Dollar Shave Club website crashed within the first hour of the video going viral. Within 48 hours, the company had received 12,000 orders. The video reached 3 million views in days and 4.75 million in three months.
Unilever acquired Dollar Shave Club for $1 billion in cash on July 19, 2016 — four years after launch. The Inc. magazine Dubin interview documents the founding and exit timeline in detail.
The strategic consequence was larger than Dollar Shave Club itself. Gillette held approximately 70% U.S. market share when DSC launched; by the time of the Unilever sale, Gillette’s share had fallen to about 54%. The Direct-to-Consumer subscription model — which DSC popularized for commodity goods — became the default playbook for hundreds of subsequent brands across mattresses (Casper), glasses (Warby Parker), pet food (Chewy), and meal kits. Recurring consumer subscriptions for things people previously bought one at a time at a store became a new business-model default.
Netflix offered $1 million for a better recommendation algorithm — and then never used the winning entry

Netflix announced the Netflix Prize in October 2006: $1 million to any team that could improve its movie-recommendation algorithm by 10% on a defined accuracy metric. The contest released an anonymized dataset of 100 million ratings and invited the public to compete. Hundreds of teams worked on the problem for nearly three years.
On September 21, 2009, a team called BellKor’s Pragmatic Chaos — combining AT&T Labs researchers (Yehuda Koren, Robert Bell, Chris Volinsky) with Commendo Research (Andreas Töscher, Michael Jahrer) — won with a 10.06% improvement over Netflix’s baseline. They received the $1 million prize. The full history of the Netflix Prize is documented at length.
Netflix never deployed the winning algorithm. By 2009 the company was pivoting from DVD rentals to streaming, where viewing data — actual watch behavior — was richer than the star ratings the contest had optimized for. The ensemble model was also computationally expensive to scale. A planned Netflix Prize 2 was cancelled when researchers de-anonymized users by cross-referencing the released dataset with public IMDb reviews, exposing privacy issues that triggered a lawsuit. The contest’s lasting effect was less the algorithm and more the cultural shift: by the mid-2010s, “because you watched X” had become the default way people discovered what to watch, buy, listen to, or read across nearly every consumer platform.
The seven shifts share a common shape. Each rewired a specific link in the chain between the consumer noticing a desire and the money leaving their account — pricing, framing, social proof, friction, financing, discovery. The cumulative effect is hard to see in any single transaction but visible at the aggregate. Americans now spend more on more things, more often, with less friction, than the 1995 baseline could have produced. The conveniences are real; so is what they were optimized to do.